The foundations of Semantic Hub metric modeling
Business analytics depends on more than a formula that runs. A useful metric must describe what is being measured, which records participate, how results are grouped, and what a total means. Semantic Hub brings these choices into a reusable semantic model so that teams can express business meaning alongside calculations.
Semantic Hub's metric model draws on established ideas from dimensional modeling, relational databases, and online analytical processing (OLAP). Its metric types and properties organize those ideas into an authoring language for reusable analytics. They are Semantic Hub's design choices rather than a taxonomy prescribed by a single academic theory.
This guide explains the foundations through small business examples. You can follow it without knowing SQL or the details of a BI tool. The examples illustrate calculation semantics; available execution and export capabilities depend on the target and release described in Limitations.
Established foundations and their business value
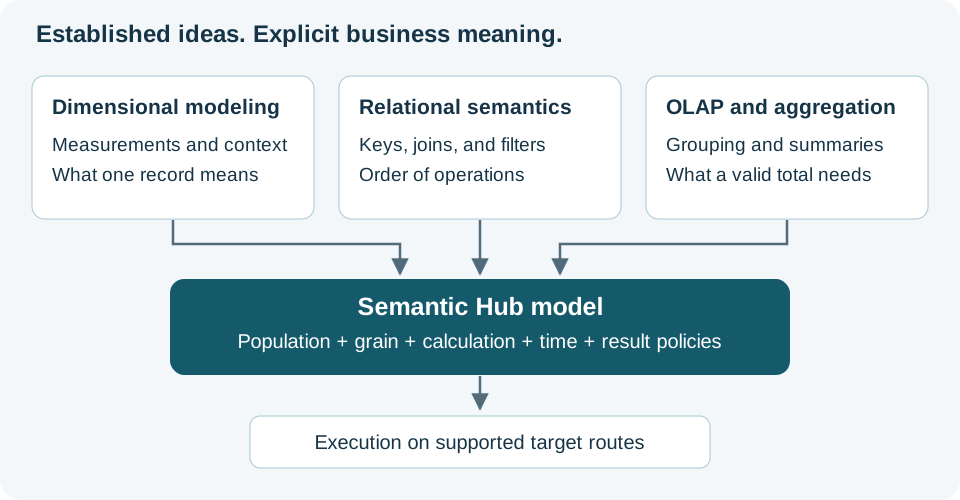
Figure 1. Semantic Hub combines established concepts into a model of business meaning. A common model gives target-specific execution a precise definition to work from.
Select an illustration to view it at full size.
Dimensional modeling starts with a business measurement and its context. A sale has an amount, a date, a product, and a customer. Declaring what one record represents makes it possible to interpret the amount correctly. Kimball's dimensional modeling techniques provide a practical foundation for grain, dimensions, facts, and relationships. Explore the Kimball techniques.
Relational semantics describe how tables, keys, joins, filters, and grouping interact. These rules matter whenever a question uses more than one dataset or changes the population of a calculation. An order related to three order lines still represents one order; repeating it in a joined result does not create three orders.
OLAP is the study and practice of analyzing measurements across dimensions such as product, region, and time. It includes drilling into detail and rolling detail into summaries. Aggregation theory explains which summaries can be combined and which require additional information. Gray and colleagues' Data Cube paper connects these operations to relational databases.
The customer value is concrete: an explicit model makes important assumptions visible and gives different calculations a consistent vocabulary. The business still defines what revenue, an active customer, or a successful conversion means. The model records those decisions.
A metric needs more than a formula
Consider the phrase average customer spending. Several interpretations are possible:
| Business question | Calculation | Population being averaged |
|---|---|---|
| How large is a typical transaction? | Average the transaction amounts | Transactions |
| How much does a purchasing customer spend? | Calculate each customer's spending, then average those totals | Customers with purchases |
| How much do registered customers spend on average? | Divide total spending by registered customer count | All registered customers, including those with no purchases |
These questions can produce different answers from the same sales data. A metric name or a single AVERAGE operation cannot distinguish them.
A complete definition makes the following choices clear:
| Modeling choice | Plain-language question | Semantic Hub concepts |
|---|---|---|
| Source grain | What does one record represent? | Datasets, keys, and relationships |
| Eligible population | Which records count? | Dataset, metric, input, and query filters |
| Calculation | What do we do with the values? | Aggregations and expressions |
| Evaluation grain | At what level do we calculate an intermediate value? | Metric grain and input evaluation context |
| Combination | How do we use intermediate results? | Derived metrics, ratios, alignment, and explicit reduction |
| Time and sequence | Which periods or events belong together? | Calendars, frames, ordering, and event matching |
| Exceptional results | What does no data, a missing period, or a zero denominator mean? | Empty, missing, null, and division policies |
The properties address different parts of meaning. For example, a filter chooses the population; a grain chooses the grouping. A calculation can have the same grouping and a different population, or the same population and a different grouping.
Grain gives measurements their meaning
Grain describes the level of detail represented by a record or a calculation. One sale, one order line, one customer, and one account balance per day are different grains.
Suppose an order has a total of $100 and three lines. Joining the order to its lines produces three rows containing the same order total. Adding that repeated column produces $300 even though the business recorded only $100.
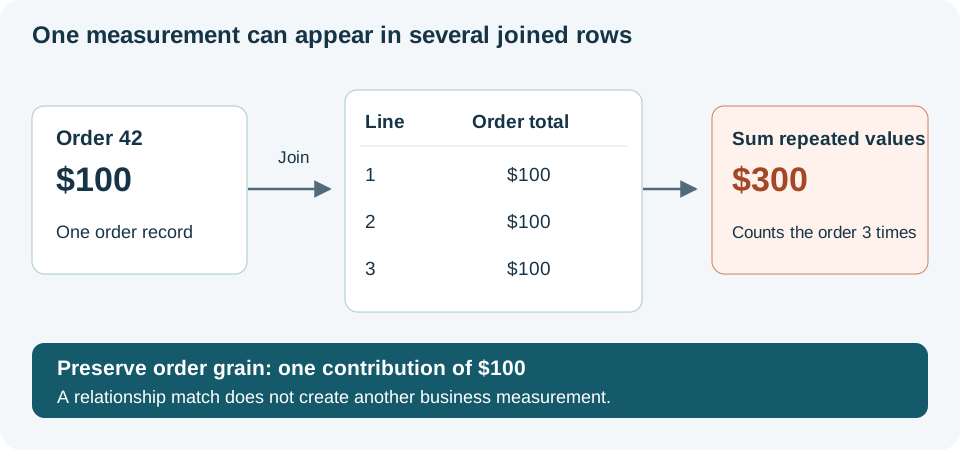
Figure 2. A relationship can repeat a value without creating another measurement. Grain determines how often that value may contribute.
Semantic Hub distinguishes the source dataset's grain, a metric's evaluation grain, and the grain where results are aligned for a query. This separation is particularly useful when, for example, sales and support tickets come from different datasets. Their metrics can be summarized independently by a compatible region before their results are combined; joining their detail records can multiply both populations.
This is why keys and relationship cardinalities are meaningful modeling information. They describe which values belong together and when a relationship can produce multiple matches. See Grain and multi-fact query planning for the detailed concepts.
Different measurements need different totals
Dimensional modeling distinguishes three common behaviors. An additive measurement can be summed across its relevant dimensions. A semi-additive measurement can be summed across some dimensions but requires another rule across others. A non-additive measurement needs a calculation other than summing its displayed values. Kimball's additivity guidance describes these categories.
| Measurement | Appropriate summary | Why |
|---|---|---|
| Sales amount in a consistent currency | Add eligible sales across products or regions | Each eligible sale contributes its amount |
| Daily account balance | Add balances across accounts at the same date; select or average dates according to the business question | Adding Monday's and Tuesday's balances does not give the closing balance |
| Profit margin | Divide total profit by total revenue | Adding or equally averaging displayed margins generally answers a different question |
| Distinct customer count | Count customers across the combined population | A customer who appears in two regions should not automatically count twice in the overall total |
The correct total follows the business definition. It is not necessarily the sum of the rows displayed in a report.
Aggregation theory explains what a summary must retain
The Data Cube paper classifies aggregates by the information needed to combine partial results:
- Distributive aggregates, such as sum, minimum, and maximum, can combine suitable partial results directly.
- Algebraic aggregates, such as average, need a fixed amount of supporting state. An average needs both a sum and a count.
- Holistic aggregates, such as an exact median, generally cannot be reconstructed from a fixed-size summary alone.
These distinctions explain why a saved subtotal is sometimes sufficient and sometimes loses essential information. They also underpin decisions about reusing summaries. Read the original paper.
A worked example with two stores
Assume every transaction has a non-null amount. Store A has two transactions of $100 each. Store B has eight transactions of $10 each.
| Store | Transaction count | Sales total | Average transaction amount |
|---|---|---|---|
| A | 2 | $200 | $100 |
| B | 8 | $80 | $10 |
| Both stores | 10 | $280 | $28 |
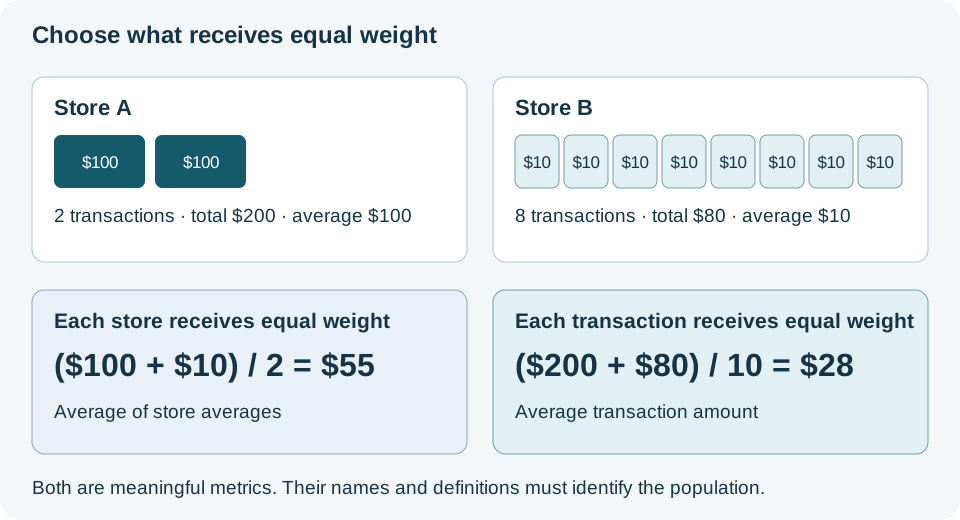
Figure 3. Both calculations are meaningful when named correctly. They average different populations.
The average transaction amount is $280 / 10 = $28. The average of the two store averages is ($100 + $10) / 2 = $55. The second result gives each store equal weight; the first gives each transaction equal weight.
This example also separates two ideas that can seem similar: preserving an existing metric while summarizing it, and defining a new metric that aggregates intermediate values. An explicit average of store averages is a valid business calculation. It should not be substituted for average transaction amount.
Semantic Hub's Aggregations and additivity guide describes the aggregate functions and their composition requirements.
Calculation stages make the order of operations explicit
The order of filtering, grouping, and calculation can change an answer. For a regional profit margin, the conceptual sequence is to choose eligible records, total profit and revenue at the requested regional grain, and then divide those totals. Computing and averaging a margin on every transaction may produce another answer.
Likewise, ranking products uses calculated product results. A conversion calculation must match events for an entity and apply its time window. These operations cannot all be treated as interchangeable arithmetic on source columns.
Semantic Hub's metric composition model describes dependencies and evaluation stages. An input can require its own grain or population before another calculation uses it. This gives an author a way to express an intermediate customer total, a fixed benchmark, or an independently evaluated denominator without leaving its meaning implicit. See Metric evaluation and composition.
Metric types make familiar questions easier to express
The metric types package common analytical operations. In Semantic Hub, canonical identifies the authoritative model definition from which supported target representations are generated. It does not imply that the names form a universal industry standard.
| Type | Question it expresses | Example |
|---|---|---|
AGGREGATE |
How do we summarize source records? | Revenue from eligible sales |
DERIVED |
What do we calculate from evaluated metric results? | Revenue minus cost |
RATIO |
How do two evaluated inputs relate through division? | Profit divided by revenue |
CUMULATIVE |
What happens over an accumulating or moving range? | Sales year to date |
WINDOW |
Where does a result stand in an ordered set? | Product rank or the previous row's value |
PERIOD_OVER_PERIOD |
How does this period compare with a corresponding period? | Change from the previous month |
CONVERSION |
Which entities complete a subsequent event under defined matching rules? | Purchase after signup within seven days |
These are modeling patterns. The YAML model format supplies their properties, and Limitations identifies execution and export boundaries.
Why some definitions look interchangeable
A ratio can sometimes be expressed as a derived expression. A dedicated ratio type makes its inputs and division policy easy to identify. A period comparison packages time alignment and comparison behavior that would otherwise require several choices.
Some overlap therefore provides a convenient vocabulary. Equivalence still depends on the entire definition: inputs, population, grain, calendar, null behavior, and operation order. An average of customer totals and an average of transactions are different metrics even if a small sample happens to give the same answer.
For a new model, begin with the business question and use the type that expresses it most directly. Add explicit context when the metric must differ from the report's grouping or filters. The Getting started guide demonstrates ordinary model authoring before advanced controls are needed.
Why analytics products expose different models
Analytics products share recurring needs: understandable measurements, trustworthy totals, analysis across dimensions, time comparisons, and reusable definitions. They expose different abstractions for those needs. DAX emphasizes evaluation context; Tableau exposes worksheet detail and level-of-detail expressions; dbt offers named simple, derived, ratio, cumulative, and conversion metrics. Their documentation illustrates these different interfaces: DAX overview, Tableau LOD semantics, and dbt metric types.
Product design also balances authoring simplicity, execution architecture, performance, and compatibility with existing models. A compact expression may depend on substantial contextual behavior. An explicit definition exposes more choices to the author. A familiar function name alone does not establish equivalent behavior across products.
Semantic Hub provides a common place to describe these choices. Target generation must then respect the model's semantics within the capabilities of the selected route. This approach makes differences easier to reason about; it does not make every vendor feature interchangeable or guarantee arbitrary model round trips.
What the solid foundation means for you
A sound theoretical foundation gives a semantic layer a clear way to explain its calculations and constraints. It does not determine the correctness of source data or replace verification of the deployment you intend to use.
When evaluating a model, ask how it defines the population, grain, time rules, and totals for your important metrics. Include a case with unequal group sizes, a customer appearing in more than one group, and a relationship with multiple matches. These examples reveal semantic differences that a simple sales total can hide.
For supported operations, Semantic Hub's compilation contract requires preservation of the declared meaning or a diagnostic when an equivalent plan cannot be produced. Correct modeling still depends on accurate source descriptions and business definitions. Consult Integrations and Limitations when choosing a target and verifying a customer use case.
Books and papers for further learning
You do not need to read all of these to start using Semantic Hub. They provide independent explanations of the concepts behind the model.
- Kimball Dimensional Modeling Techniques. A free introduction. Start with grain, facts, dimensions, additivity, and drilling across.
- Ralph Kimball and Margy Ross, The Data Warehouse Toolkit, third edition, 2013. A practical book that builds from dimensional modeling fundamentals to business case studies.
- Jim Gray and colleagues, Data Cube: A Relational Aggregation Operator Generalizing Group-By, Cross-Tab, and Sub-Totals, 1997. A research paper connecting multidimensional analysis to relational aggregation. Section 5 explains distributive, algebraic, and holistic aggregates.
Continue with Modeling concepts for Semantic Hub terminology and Getting started for a complete first model.