PERIOD_OVER_PERIOD metrics with TPC-H
A PERIOD_OVER_PERIOD metric compares a business measure with the same measure in an earlier or later period. Use it to answer questions such as “How much did revenue change since last month?” or “How many customers ordered this quarter compared with the same quarter last year?”
This guide starts with monthly shipped revenue, explains each YAML property, and then extends the example to order value, customer counts, other calendars, and filtered views. It also explains the logical mapping for readers familiar with SQL, Power BI, or Tableau.
You need a dataset, a numeric base metric, a date field, and a model exposing them. If these concepts are new, start with the TPC-H modeling walkthrough. The model format reference describes where the metric fits in the schema.
Understand the comparison
The metric performs three operations:
- Evaluate the base measure at the comparison grain, such as one revenue value per month.
- Find the matching period using the declared offset, within the same grouping dimensions.
- Return the matched value or calculate the difference, ratio, or percentage change.
“Grain” means the detail represented by one result value. A line item is a source-row grain; a month is the comparison grain in this example.
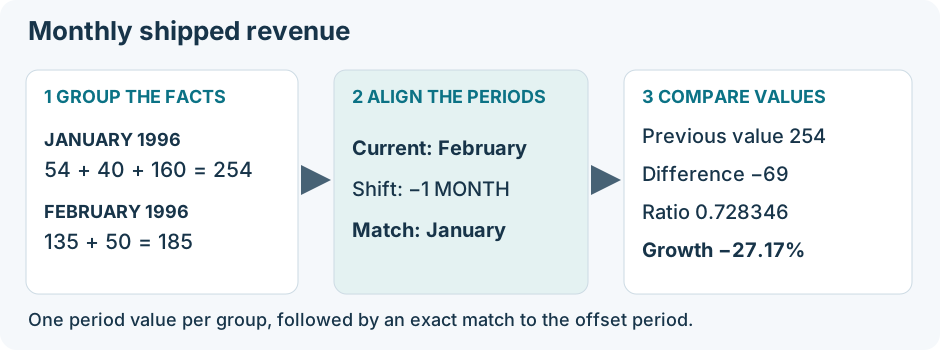
Monthly revenue is aggregated before comparison. Multiple line items contribute to one period value.
The time field determines which event assigns a row to a period. TPC-H offers several choices:
| Business measure | Source definition | Time field | Meaning |
|---|---|---|---|
| Stored order value | SUM(O_TOTALPRICE) |
orders.order_date |
Value assigned to the month the order was placed. |
| Discounted line revenue | SUM(L_EXTENDEDPRICE * (1 - L_DISCOUNT)) |
lineitem.ship_date |
Revenue assigned to the shipment month. |
| Discounted line revenue | The same line-revenue formula | lineitem.receipt_date |
Revenue assigned to the receipt month. |
Order value and discounted line revenue are separate measures. Choosing a different time field changes the question even when the amount formula stays the same.
Read a metric definition
Here is a monthly revenue growth metric, placed in the metrics collection of the lineitem dataset:
- name: revenue_monthly_growth
  metric_type: PERIOD_OVER_PERIOD
  base_metric: { metric_ref: revenue }
  time_dimension: ship_date
  comparison_grain: MONTH
  offset:
    value: -1
    unit: MONTH
    alignment: CALENDAR
  comparison: PERCENT_CHANGE
  null_handling:
    divide_by_zero: "NULL"
| Property | What it means | What to author |
|---|---|---|
name |
The reusable metric name. | A name describing the measure and comparison. |
metric_type |
The kind of calculation. | PERIOD_OVER_PERIOD. |
base_metric |
The measure evaluated independently in both periods. | An object such as { metric_ref: revenue }. |
time_dimension |
The authored field used to identify periods. | ship_date, not the physical column name L_SHIPDATE. |
comparison_grain |
The grain at which values are grouped and aligned. | DAY, WEEK, MONTH, QUARTER, or YEAR. |
offset.value and offset.unit |
How far to move from the current period. | A nonzero integer and DAY, WEEK, MONTH, QUARTER, or YEAR. |
offset.alignment |
How the period is shifted. | CALENDAR for calendar periods; EXACT for supported fixed day/week shifts. |
comparison |
The result to calculate. | One of the four modes below. |
null_handling |
Policies for missing periods, NULL values, and zero denominators. | Choose these separately according to business meaning. |
Quote policy values such as "NULL" in YAML so they remain string keywords rather than YAML null values.
The base, time dimension, offset, and comparison are required. You may omit comparison_grain when the time field has one unambiguous supported grain. Declaring it explicitly makes a reusable metric easier to understand.
Negative offsets look backward; positive offsets look forward. PREVIOUS_VALUE returns the offset value even for a positive offset, so name a forward-looking metric accordingly. It reads existing later-period data; it does not predict future values.
Build the monthly revenue example
Reuse the TPC-H base measure
The TPC-H lineitem dataset already has a revenue metric and shipment date field. These are the relevant entries:
fields:
  - name: ship_date
    data_type: DATE
    expression: L_SHIPDATE
    time_type: DAYS

metrics:
  - name: revenue
    metric_type: AGGREGATE
    aggregation: SUM
    expression: L_EXTENDEDPRICE * (1 - L_DISCOUNT)
time_type: DAYS describes the source date grain. The monthly comparison below asks the canonical SQL route to regroup those dates into month-start DATE values. Merely setting a raw date field to MONTHS would not make its expression a month boundary.
The snippets in this guide are entries to merge into the existing dataset or model collections. Preserve the TPC-H keys, joins, other fields, and existing metrics; do not replace an entire dataset with a fragment.
Add all four comparison modes
Add these entries to lineitem.metrics. They share a base, time field, grain, and offset, so they can appear together in one monthly query.
- name: revenue_previous_month
  metric_type: PERIOD_OVER_PERIOD
  base_metric: { metric_ref: revenue }
  time_dimension: ship_date
  comparison_grain: MONTH
  offset: { value: -1, unit: MONTH, alignment: CALENDAR }
  comparison: PREVIOUS_VALUE

- name: revenue_monthly_difference
  metric_type: PERIOD_OVER_PERIOD
  base_metric: { metric_ref: revenue }
  time_dimension: ship_date
  comparison_grain: MONTH
  offset: { value: -1, unit: MONTH, alignment: CALENDAR }
  comparison: DIFFERENCE

- name: revenue_monthly_ratio
  metric_type: PERIOD_OVER_PERIOD
  base_metric: { metric_ref: revenue }
  time_dimension: ship_date
  comparison_grain: MONTH
  offset: { value: -1, unit: MONTH, alignment: CALENDAR }
  comparison: RATIO
  null_handling: { divide_by_zero: "NULL" }

- name: revenue_monthly_growth
  metric_type: PERIOD_OVER_PERIOD
  base_metric: { metric_ref: revenue }
  time_dimension: ship_date
  comparison_grain: MONTH
  offset: { value: -1, unit: MONTH, alignment: CALENDAR }
  comparison: PERCENT_CHANGE
  null_handling: { divide_by_zero: "NULL" }
Let current be this month's revenue and offset be the matched month's revenue:
| Comparison | Calculation | February in this example |
|---|---|---|
PREVIOUS_VALUE |
offset |
254.00 |
DIFFERENCE |
current - offset |
−69.00 |
RATIO |
current / offset |
0.728346… |
PERCENT_CHANGE |
current / offset - 1 |
−0.271654…, displayed as −27.1654%. |
PERCENT_CHANGE returns a fraction. Format 0.10 as 10%; do not multiply by 100 and also apply percentage formatting.
Select the time field and metrics
Use the existing TPC-H DuckDB analytics model:
from: orders_analytics_duckdb
select:
  - lineitem.ship_date
  - lineitem.revenue
  - lineitem.revenue_previous_month
  - lineitem.revenue_monthly_difference
  - lineitem.revenue_monthly_ratio
  - lineitem.revenue_monthly_growth
order_by:
  - { field: lineitem.ship_date, direction: asc }
The selected time field is required for period alignment. On the canonical SQL route, the MONTH comparison returns ship_date as the month's start date. January's three sample line amounts, 54.00, 40.00, and 160.00, total 254.00. February's two amounts, 135.00 and 50.00, total 185.00.
| Output period | Revenue | Previous month | Difference | Ratio | Growth |
|---|---|---|---|---|---|
| 1996-01-01 | 254.00 | NULL | NULL | NULL | NULL |
| 1996-02-01 | 185.00 | 254.00 | −69.00 | 0.728346… | −27.1654% |
These values describe the small bundled TPC-H example, not a full benchmark database. January has no December comparison in that sample. Its NULL comparison is meaningful.
Choose the grain and offset
Grain and offset answer different questions. comparison_grain: MONTH with unit: YEAR compares a month's total with the same month one year earlier. comparison_grain: YEAR with unit: YEAR compares annual totals.
Use the same definition pattern, changing the properties shown here. Each row defines a separate metric in lineitem.metrics with base revenue and time dimension ship_date.
| Metric name | Grain | Offset | Alignment | Comparison |
|---|---|---|---|---|
revenue_previous_day |
DAY | −1 DAY | EXACT | PREVIOUS_VALUE |
revenue_daily_growth |
DAY | −1 DAY | EXACT | PERCENT_CHANGE |
revenue_same_weekday_difference |
DAY | −1 WEEK | EXACT | DIFFERENCE |
revenue_weekly_growth |
WEEK | −1 WEEK | CALENDAR | PERCENT_CHANGE |
revenue_monthly_yoy_growth |
MONTH | −1 YEAR | CALENDAR | PERCENT_CHANGE |
revenue_previous_quarter |
QUARTER | −1 QUARTER | CALENDAR | PREVIOUS_VALUE |
revenue_quarterly_growth |
QUARTER | −1 QUARTER | CALENDAR | PERCENT_CHANGE |
revenue_quarterly_yoy_growth |
QUARTER | −1 YEAR | CALENDAR | PERCENT_CHANGE |
revenue_annual_growth |
YEAR | −1 YEAR | CALENDAR | PERCENT_CHANGE |
revenue_next_month |
MONTH | +1 MONTH | CALENDAR | PREVIOUS_VALUE |
For example, same-month growth against the previous year is:
- name: revenue_monthly_yoy_growth
  metric_type: PERIOD_OVER_PERIOD
  base_metric: { metric_ref: revenue }
  time_dimension: ship_date
  comparison_grain: MONTH
  offset: { value: -1, unit: YEAR, alignment: CALENDAR }
  comparison: PERCENT_CHANGE
  null_handling: { divide_by_zero: "NULL" }
Use separate queries for monthly, quarterly, and annual comparisons sharing ship_date. One selected time identity cannot currently carry conflicting comparison grains. Include the year in period identities; grouping by month number alone would combine January from different years.
For a DAY identity shifted by calendar months or years, the destination day clamps when necessary. January 31 plus one month becomes February 28 or 29. The shift does not preserve a source “last day of month” flag. This detail differs from grouping all January facts into a MONTH identity of January 1.
Compare orders and customers
The TPC-H orders dataset already defines order_value = SUM(O_TOTALPRICE) and order_count = COUNT_ROWS. Place order-date comparison metrics in that dataset.
For a focused order example, add a model rooted at orders while excluding its reverse line-item branch:
name: orders_pop_duckdb
connection: duckdb_tpch
root_datasets:
  - dataset: orders
    exclude_join_paths: [lines]
This model reuses the existing orders and customer relationships. Add these base metrics to orders.metrics:
- name: active_buyers
  metric_type: AGGREGATE
  aggregation: COUNT_DISTINCT
  expression: O_CUSTKEY

- name: average_order_value
  metric_type: RATIO
  numerator: { metric_ref: order_value }
  denominator: { metric_ref: order_count }
  null_handling: { divide_by_zero: "NULL" }

- name: finished_order_value
  metric_type: AGGREGATE
  aggregation: SUM
  expression: O_TOTALPRICE
  filter: O_ORDERSTATUS = 'F'
Here “finished” explicitly means TPC-H status F. The average uses all counted orders as its denominator. A different business population needs a different base definition.
Use time_dimension: order_date, comparison_grain: MONTH, and offset -1 MONTH / CALENDAR to define:
| Metric name | Base metric | Comparison | Question |
|---|---|---|---|
order_value_monthly_growth |
order_value | PERCENT_CHANGE | How did stored order value change? |
order_count_monthly_difference |
order_count | DIFFERENCE | How many more or fewer orders were placed? |
active_buyers_monthly_growth |
active_buyers | PERCENT_CHANGE | Did distinct ordering customers increase? |
average_order_value_monthly_growth |
average_order_value | PERCENT_CHANGE | Did value per order change? |
finished_order_value_monthly_growth |
finished_order_value | PERCENT_CHANGE | How did value for status F change? |
For example:
- name: active_buyers_monthly_growth
  metric_type: PERIOD_OVER_PERIOD
  base_metric: { metric_ref: active_buyers }
  time_dimension: order_date
  comparison_grain: MONTH
  offset: { value: -1, unit: MONTH, alignment: CALENDAR }
  comparison: PERCENT_CHANGE
  null_handling: { divide_by_zero: "NULL" }
Query it with its base measure:
from: orders_pop_duckdb
select:
  - orders.order_date
  - orders.active_buyers
  - orders.active_buyers_monthly_growth
order_by:
  - { field: orders.order_date, direction: asc }
Evaluate each base at the requested comparison grain. In the sample, one customer orders on two January days: January has one active buyer, not two. Summing daily distinct counts would give the wrong monthly base.
| Base measure | January 1996 | February 1996 | February percentage change |
|---|---|---|---|
| Order value | 300.00 | 200.00 | −33.3333% |
| Order count | 2 | 2 | 0% |
| Active buyers | 1 | 2 | +100% |
| Average order value | 150.00 | 100.00 | −33.3333% |
| Finished-order value | 100.00 | 200.00 | +100% |
For order_count_monthly_difference, the result is 0 orders. The percentage column above illustrates the alternate PERCENT_CHANGE mode.
The ratio-base average example is intended for a compatible canonical SQL query. It does not imply that every native model export supports staged ratio bases. A period metric cannot currently use a cumulative, window, or another period metric as its base.
To compare received rather than shipped revenue, define a separate metric with base_metric: { metric_ref: revenue } and time_dimension: receipt_date, and select lineitem.receipt_date in its query.
Choose a calendar
Without a named calendar, supported civil comparisons use Gregorian behavior. A named calendar makes the week or fiscal boundary explicit.
Add this object to the selected model's time_settings:
time_settings:
  default_calendar: civil
  fill_missing_periods: SKIP
  calendars:
    - name: civil
      calendar_type: GREGORIAN
      week_start: MONDAY
    - name: sunday_week
      calendar_type: GREGORIAN
      week_start: SUNDAY
    - name: iso
      calendar_type: ISO_8601
      week_start: MONDAY
    - name: fiscal_july
      calendar_type: FISCAL
      fiscal_year_start_month: 7
      fiscal_year_start_day: 1
A metric selects a calendar with the common property time_context. For example:
- name: revenue_fiscal_quarterly_growth
  metric_type: PERIOD_OVER_PERIOD
  base_metric: { metric_ref: revenue }
  time_dimension: ship_date
  comparison_grain: QUARTER
  time_context: { calendar: fiscal_july }
  offset: { value: -1, unit: QUARTER, alignment: CALENDAR }
  comparison: PERCENT_CHANGE
  null_handling: { divide_by_zero: "NULL" }
| Example | Calendar | Grain and offset | Period interpretation |
|---|---|---|---|
| Sunday weekly growth | sunday_week | WEEK / −1 WEEK | Weeks start Sunday. |
| ISO weekly growth | iso | WEEK / −1 WEEK | Weeks start Monday. |
| ISO annual growth | iso | YEAR / −1 YEAR | Compare ISO week years, which can cross civil-year boundaries. |
| Fiscal quarterly growth | fiscal_july | QUARTER / −1 QUARTER | Quarter starts are July 1, October 1, January 1, and April 1. |
| Fiscal annual growth | fiscal_july | YEAR / −1 YEAR | Compare July–June populations. |
Returned fiscal period dates identify their starts. Choose a separate display label if the business names a fiscal year after its ending year. The small two-month TPC-H sample cannot demonstrate prior-year growth; use data covering both comparison populations.
A metric calendar overrides the model default. Standalone DATE values do not move to another civil day when an IANA time zone is declared. Timestamp conversion and daylight-saving behavior require additional support; see the route qualifications below.
Keep comparison data when filtering the view
A query showing only February still needs January to calculate February's month-over-month growth.
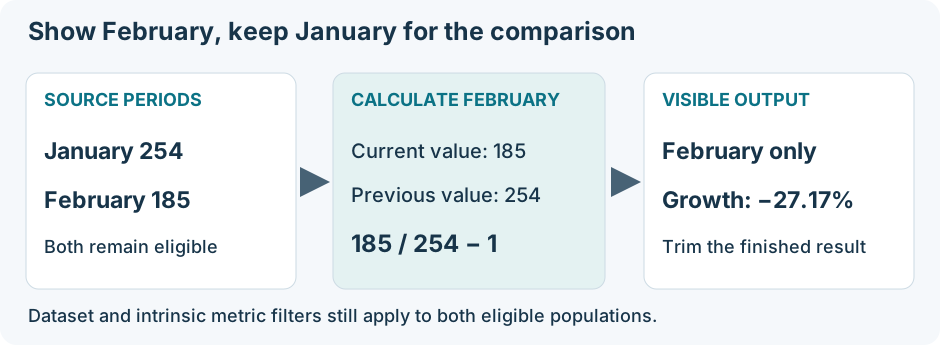
Visible period selection follows comparison. Intrinsic dataset and metric filters still restrict eligible source rows.
This query returns monthly shipped revenue for the BUILDING customer segment, showing only February:
from: orders_analytics_duckdb
select:
  - customer.market_segment
  - lineitem.ship_date
  - lineitem.revenue
  - lineitem.revenue_previous_month
  - lineitem.revenue_monthly_growth
where: >
  lineitem.ship_date >= DATE('1996-02-01')
  AND lineitem.ship_date < DATE('1996-03-01')
  AND customer.market_segment = 'BUILDING'
order_by:
  - { field: lineitem.ship_date, direction: asc }
The segment creates an independent series: BUILDING in February compares with BUILDING in January. Its non-time predicate applies to both periods. The visible date bounds apply to the finished comparison result. In the sample, BUILDING has 50.00 in February and 254.00 in January, giving approximately −80.3150% growth.
An intrinsic base filter, such as finished_order_value.filter: O_ORDERSTATUS = 'F', restricts both periods. An intrinsic date filter also remains a source restriction; it cannot be bypassed to retrieve an earlier comparison.
The current canonical route supports separable time predicates on selected temporal fields in a single-root query without row attachments. A mixed condition such as ship_date >= DATE('1996-02-01') OR market_segment = 'BUILDING' needs additional planning and is diagnosed. See filter semantics for filter ownership.
Distinguish missing periods from NULL and zero
An aligned period can be absent, present with a NULL base value, or present with a zero base value. These states need different business decisions.
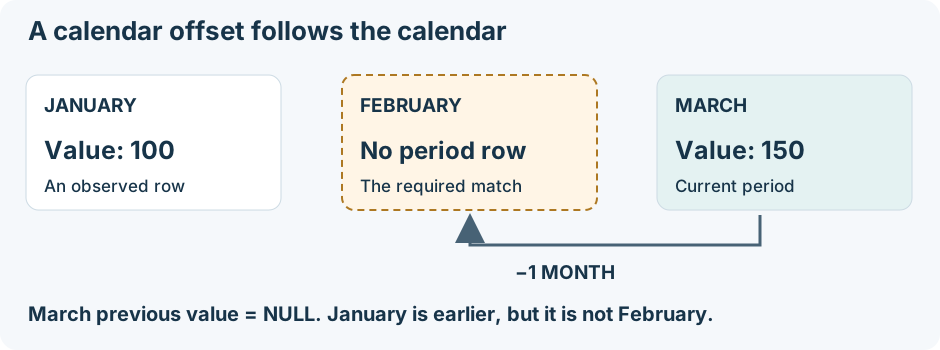
This illustrative sparse series is separate from the TPC-H sample. Calendar alignment looks for February, not the previous displayed row.
For a PREVIOUS_VALUE metric:
| Policy object | No matched period | Matched period with NULL base | Matched period with base 0 |
|---|---|---|---|
{ missing_period_result: "NULL", null_result: "NULL" } |
NULL | NULL | 0 |
{ missing_period_result: ZERO, null_result: "NULL" } |
0 | NULL | 0 |
{ missing_period_result: "NULL", null_result: ZERO } |
NULL | 0 | 0 |
missing_period_result handles absence of the matching identity. null_result handles a NULL calculation when that identity is present; it also applies to a present comparison's NULL arithmetic result. Neither policy inserts absent months into the output.
For RATIO and PERCENT_CHANGE, divide_by_zero handles a non-NULL offset value of zero:
| Policy | RATIO when offset is 0 | PERCENT_CHANGE when offset is 0 |
|---|---|---|
NULL |
NULL | NULL |
ZERO |
0 | −1, displayed as −100% |
ALTERNATE with alternate_value: -7 |
−7 | −8, displayed as −800% |
The fallback applies to the division operation; PERCENT_CHANGE then subtracts one. A subsequent null_result: ZERO can turn a NULL final calculation into zero. Keep these effects in mind before choosing a fallback.
divide_by_zero and alternate_value apply only to ratio-like comparisons. ERROR exists in the authoring schema but is currently diagnosed for period comparisons. A NULL denominator is not a zero denominator.
Map the metric to SQL Power BI and Tableau
The following representations explain the calculation. The generated artifact and supported route depend on the selected target; these examples are not interchangeable deployment instructions.
| Semantic Hub concept | SQL representation | Power BI representation | Tableau representation |
|---|---|---|---|
| Base metric | Aggregate expression | Measure | Aggregated measure |
| Time field and grain | Period key in GROUP BY | Date/calendar context at a chosen grain | Date level in the view or period key |
| Offset | Join to the shifted period key | Shift date context while retaining other filters | Locate the matching period; row offsets require a suitable view |
| Other grouping dimensions | Match the same keys on both sides | Retain non-time filter context | Partition the comparison into independent series |
| Comparison mode | Arithmetic after alignment | Measure arithmetic | Calculated-field arithmetic |
| Missing-period policy | Check matched-row presence separately from value | Preserve presence separately from BLANK | Preserve period presence separately from NULL |
SQL aggregate then align
This DuckDB-style SQL illustrates the global monthly revenue query. It groups source facts first, joins January to February by period identity, and applies the visible bounds last.
WITH monthly AS (
  SELECT
    CAST(DATE_TRUNC('month', L_SHIPDATE) AS DATE) AS period,
    SUM(L_EXTENDEDPRICE * (1 - L_DISCOUNT)) AS revenue,
    1 AS period_present
  FROM LINEITEM
  GROUP BY 1
)
SELECT
  current_period.period,
  current_period.revenue,
  CASE WHEN offset_period.period_present IS NULL
       THEN NULL ELSE offset_period.revenue END AS offset_period_revenue,
  current_period.revenue - offset_period.revenue AS difference,
  current_period.revenue / NULLIF(offset_period.revenue, 0) AS ratio,
  current_period.revenue / NULLIF(offset_period.revenue, 0) - 1 AS growth
FROM monthly AS current_period
LEFT JOIN monthly AS offset_period
  ON offset_period.period =
     CAST(current_period.period - INTERVAL '1 month' AS DATE)
WHERE current_period.period >= DATE '1996-02-01'
  AND current_period.period < DATE '1996-03-01'
ORDER BY current_period.period;
For segment-level comparisons, group by segment as well as period, and match both keys with the appropriate NULL semantics. Other policies need explicit presence and fallback branches.
SQL LAG addresses a previous row in the window, so a sparse series can produce a different result from a calendar shift. A row-offset rewrite requires a suitable dense period series and matching order. See the PostgreSQL window-function reference.
Power BI shift the date context
For a standard Gregorian monthly report, an analogous hand-authored DAX pattern is:
Revenue =
SUMX (
    LINEITEM,
    LINEITEM[L_EXTENDEDPRICE] * (1 - LINEITEM[L_DISCOUNT])
)

Revenue Previous Month =
CALCULATE (
    [Revenue],
    DATEADD ( 'Date'[Date], -1, MONTH )
)

Revenue Monthly Growth =
VAR CurrentValue = [Revenue]
VAR PreviousValue = [Revenue Previous Month]
RETURN
    IF (
        ISBLANK ( CurrentValue ) || ISBLANK ( PreviousValue ),
        BLANK (),
        DIVIDE ( CurrentValue, PreviousValue ) - 1
    )
Assume a suitable daily Date table related to shipment date and a report grouped by full Gregorian months. Date-column DATEADD shifts the current date selection and requires a contiguous selection; partial selections and other calendars need their own equivalent semantics. It is a conceptual mapping for this monthly example, not a universal replacement for Semantic Hub alignment. See Microsoft's DATEADD reference.
DIVIDE provides the division fallback. The BLANK guard above retains an unknown current or comparison value before applying the growth formula. Missing-period and present-NULL distinctions need additional presence logic; COALESCE alone merges those states. See Microsoft's DIVIDE reference.
Semantic Hub's current Power BI period route is an explicit grouped query route. It captures period and grouping keys and aligns the grouped results. Ordinary native model export does not publish a standalone PoP measure by substituting the illustrative DAX above. Changing report grouping requires a compatible query definition.
Tableau address a suitable period series
For a view with one chronologically ordered row per month within each segment, an analogous calculation is:
// Row-level calculated field
[Net Line Revenue] =
[L_EXTENDEDPRICE] * (1 - [L_DISCOUNT])

// Table calculation
[Previous Revenue] =
LOOKUP(SUM([Net Line Revenue]), -1)

// Table calculation using the previous result
[Monthly Growth] =
IF NOT ISNULL([Previous Revenue])
   AND [Previous Revenue] <> 0
THEN SUM([Net Line Revenue]) / [Previous Revenue] - 1
END
Configure the calculation to address months and partition by the other grouping dimensions. Tableau LOOKUP uses a relative row position. If February is missing, the row before March might be January. It represents a one-month offset only when the view's period sequence makes those positions equivalent. Tableau's function named PREVIOUS_VALUE has a different purpose; it is not the direct mapping of Semantic Hub's comparison mode. See Tableau's table-calculation reference.
Keep required comparison periods available to the calculation when restricting the displayed view. Semantic Hub's current explicit Tableau period route uses grouped custom SQL to preserve calendar alignment and lookback; the illustration does not promise automatic conversion to a native table calculation.
Understand current target support
The YAML schema expresses the business definition. A selected compiler route must also support its calendar, grain, base stage, and value policies.
| Route | Current period-comparison scope | What to account for |
|---|---|---|
| Canonical SQL | Snowflake, DuckDB, PostgreSQL, Oracle, and Databricks DATE comparisons; all four modes; supported signed offsets; Gregorian, ISO, and simple fiscal calendars. | Can regroup source DATE values to a coarser comparison grain. Keep each selected time identity at one compatible grain/calendar. |
| Snowflake semantic views | Native grouped DATE period comparisons within the supported base/stage profile. | Supply an already-authored comparison-grain DATE identity. Native ISO YEAR and month-end fiscal QUARTER regeneration remain unsupported. Keep consumer source data broad enough for comparison. |
| Power BI explicit period queries | Grouped DAX query route with supported DATE comparisons and visible-date filtering. | Use an already-authored comparison-grain DATE identity and the supported grouping/base profile. This is separate from ordinary native model export. |
| Tableau explicit period queries | Grouped custom-SQL route for the supported Snowflake source profile. | Use an already-authored comparison-grain DATE identity. Existing source/relationship restrictions apply; this is separate from ordinary native calculated-field export. |
Custom calendars/time spines, dense missing-period filling, timestamp/DST normalization, and completeness checks remain outside the current period profile. The schema property complete_periods_only: true requests proof that both periods are complete; current routes return a diagnostic rather than making that assumption. Selecting every visible date in a month does not itself prove that the source data is complete.
A diagnostic identifies a definition or requested operation the compiler cannot preserve. Compilation fails for that request instead of publishing an approximated query or model artifact. See support and limitations before choosing a deployment route.
Check your definition
Before using a period comparison, verify these choices:
- The base measure represents the intended business amount or count at the correct source grain.
- The time dimension is an authored field and identifies the intended event.
- The comparison grain and offset describe the actual question.
- The query selects the comparison time field and uses a compatible grouping.
- Calendar names resolve in the selected model.
- Current and offset populations retain the intended non-time and intrinsic filters.
- Missing-period, NULL-result, and zero-denominator policies are intentional.
- Source data covers the required lookback or lookahead, and the target route supports the definition.
Continue with the metric format reference, time intelligence, and metric evaluation and composition.